1. The number, and why the number is not the point
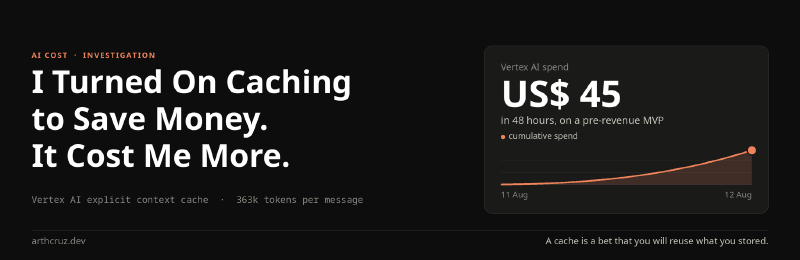
Over 11 and 12 August 2026, my Vertex AI bill went up by R$252, roughly US$45 at the exchange rate I use for costing. Written like that, it sounds like nothing. Here is the part that matters: the product was a pre-revenue MVP with a handful of people testing it by hand, and that was 48 hours. Essentially nobody was using it.
What made it worth chasing was not the size of the number, it was that the number had come unhooked from usage. A bill that tracks traffic is the reassuring case: with almost nobody using the product it stays near zero, and anything that moves it has a cause you can point at. This one was climbing while essentially nobody was using the product. Something was charging me on its own schedule rather than on mine, and since I did not know what, I had no way of knowing where it stopped.
The cause turned out to be a cache. Specifically, one I had switched on to test an idea, that passed the test, and that I then forgot was still running.
2. What the system was doing
The product is a chat commerce for supermarkets, built at Tela Azul. You type something like “churrasco for 10 people” and it builds the cart: real products, real ids, real prices, from a supermarket catalogue of about 9,000 items.
That last constraint is the whole design problem. The model cannot invent a product. It has to choose from the catalogue, by id, because names repeat (the same product appears on promotion and off it). The first working version solved this in the most direct way available: send the whole catalogue with every request.
Compacted, the entire catalogue came to roughly 363,000 input tokens per message. It worked, and the accuracy was good, because the model genuinely saw everything it was choosing from. But 363k input tokens per message is not a number you can leave in place.
3. Why I turned the cache on
Vertex AI supports explicit context caching: you upload content once, get a cachedContent handle back, and reference that handle on subsequent requests instead of resending the content.
The reasoning felt airtight. The catalogue is identical from one request to the next. Pay for those 363k tokens once, point at them afterwards, stop paying per message. The code grew a second mode for exactly this, with inline as the fallback:
export type CatalogContext =
  | { mode: 'cache'; cachedContent: string; /* ... */ }   // preferred
  | { mode: 'inline'; systemInstruction: string; /* ... */ };
I turned it on as an experiment, not as a finished decision, and what the experiment was checking was behaviour: whether the model still picked well with the catalogue sitting in a cache instead of inside the message. It did. The answers held up. Then I moved on to the next thing and left it enabled, without ever checking the other half of it, which was what the cache was doing to the bill.
That is the part of the story that matters. A feature flag sits still and waits for you. An explicit cache does not: it has a meter running, and mine kept running for days while I was busy elsewhere.
I want to be precise about the mistake here, because it was not a coding mistake. The code did what I told it to. What was wrong was my model of how the feature is billed, and how long I left it unattended after the test had already answered my question.
4. How explicit caching is actually billed
An explicit cache is not a discount. It is a rental, and it has three separate lines:
| line | when you pay | what drives it |
|---|---|---|
| creation | every time a cache is created | the tokens you put in, charged once at the standard input price (here: 363k of them) |
| storage | per hour of the cache’s life | tokens stored × wall-clock time, prorated by the minute, whether or not anyone reads them |
| reads | on each request that references the cache | discounted steeply against normal input tokens |
My mental model was: pay once to create it, then read it cheaply enough that the catalogue stopped being a per-message cost. Two things were wrong with that. Creation was not once, and the storage line was not in the model at all. The discounted read, the only one of the three that comparisons ever mention, was the part I had right.
The storage line deserves a second reading: it is charged per hour of the cache’s lifetime, independent of traffic. An explicit cache holding 363,000 tokens costs the same in storage at 4 a.m. with zero requests as it does under load.
5. The hunt, and what I looked at first
The budget alert I had set at R$100 fired first. It told me the total had moved, which is the only thing a threshold on a sum can tell you, so I opened the GCP billing page to see the shape of it. What was there was not a total, it was a slope: daily spend climbing at a rate that made no sense for the number of people using the app, and climbing for a couple of days already. By then the cache had stopped being something I thought about at all, so it never occurred to me as the culprit.
My first suspicion was voice, and I still think it was the reasonable first guess. Text-to-speech is by far the most expensive unit in the system: audio output was billed at around US$10 per 1M tokens when I measured this, an order of magnitude above anything else in the stack, and the cost scales with the length of text the client sends. Both /api/tts and /api/transcribe accepted client-supplied payloads with no size ceiling, with no authentication and no session concept anywhere in the app. If something was going to burn money in this system, that was the candidate. A rate limit does not save you when a single request can carry 50,000 characters.
So I went to the event log. The log answered nothing at all.
The backup from 13 August held 424 logged events, every one of them kind: 'chat'. Not a single tts event and not a single transcribe event had ever been recorded, because those paths had never been instrumented. I could not confirm the voice hypothesis and I could not kill it either.
That absence is itself the finding. I had a cost I could not attribute, in a system where the only path being measured was the cheap one.
What I could measure was text: R$0.0180 per message, established over 13–14 August. Multiply that by any plausible message count from a handful of manual testers and you do not get close to R$252. The money was not in the per-message token bill. Something structural was charging me.
6. The mechanism: creations stacked, storage overlapped
Once I stopped looking at request volume and started looking at cache lifecycle, it resolved.
The “once” in my head was fiction. Caches were being created far more often than I had assumed, and each one kept billing storage until its TTL expired. Two costs compounding:
- Creation, repeatedly. Cache creation is billed at the standard input price, so writing 363,000 tokens into a cache costs exactly what sending those 363,000 tokens inline would have cost. Create one per message and you have paid the original bill in full, then bought storage and a discounted read on top of it. The cache was never replacing the old cost, it was adding to it.
- Overlapping storage windows. Multiple caches of the same catalogue were alive simultaneously, each renting space by the hour until it aged out.
Per request, the discount was real. Across the two days, it never arrived. The cache did not amortise the catalogue, it multiplied it, and it moved the charge onto a line item nobody was reading.
It is worth naming what class of failure this is, because it changed how I think about spending controls. No application rate limit would have caught this. The hourly storage clock runs while nobody is making requests at all. Per-IP ceilings, per-route ceilings, the whole toolbox I later designed: none of it watches an idle cache. A global ceiling would have capped the creations, which is why it stays on the list, but the storage half of the bill was invisible to application logic by construction.
7. The fix was not a better cache
I could have tuned the TTL. I could have made sure a single handle was reused. Both would have reduced the number without addressing why it existed.
The honest reading was that the cache was compensating for the design. 363,000 tokens per message is not a caching problem. It is a “you are sending the model your entire database” problem, and caching it only makes the bill quieter.
So the catalogue stopped going to the model at all. In its place, a two-step retrieval:
- Planner (Flash-Lite, cheap) turns the message into a structured cart plan: canonical items, quantities, search terms, filters.
- Grounding resolves each planned item against the catalogue in Postgres, by vector similarity plus lexical matching, producing a pool of 150 to 600 products, balanced by construction so that every planned item has candidates in it.
Only the pool reaches the model.
Cutting a catalogue down to a few hundred candidates is a bet on recall, so it did not ship on the cost number alone. The change was measured against an automated battery of scripted shopping sessions, run repeatedly against both designs, and the carts it produced had to hold up against the old ones before the saving counted for anything.
| before | after | |
|---|---|---|
| catalogue sent per message | ~9,000 products, ~363k tokens | pool of 150–600 products |
| synthesis input tokens | ~363,000 | ~5,374 |
| explicit cache | there to make that affordable, and not doing it | deleted |
A pool of a few hundred products is cheap enough to send inline on every single request, so the 'cache' mode became dead code (nothing read it) and it was deleted along with the cache creation itself. The comment left in its place is this whole post in five lines:
There is only one mode. There used to be a second one,
'cache', from the previous design, in which the ENTIRE catalogue went to the model and was parked in acachedContentso as not to pay 363 thousand input tokens per message. Retrieval made that obsolete: today only the retrieved POOL goes (150 to 600 products), which is cheap enough to keep going inline. The'cache'mode became dead code (nothing read it) and was removed along with the cache creation, which charged storage by the hour.
8. Not all caching is explicit caching
One separation is worth making before the conclusions, because the lesson of this post is not “caching is bad”.
What cost me money was an explicit cache: content I uploaded on purpose, a handle I held, storage I rented by the hour. There is also implicit caching, where the provider reuses a matching prefix across requests on its own. Cached tokens are billed at a fraction of the normal input rate, nothing is stored on your behalf, and there is no hourly line on the invoice. You do not configure it and you cannot forget it running. You either give it a stable prefix or you do not.
That difference is the whole distance between the two caches in my story. The one I configured and forgot charged me by the clock. The other one cannot be left on by accident, because there is nothing to leave on. What the implicit one is actually worth, once you rearrange the prompt so it can do its job, is a story I tell in another post.
9. What was actually missing: attribution, not an alarm
The code change was not the real remediation. Two days after the incident I wrote down the state of the system:
- no rate limit on any route, only retry-on-429
- no authentication, no cookie, no session, no user concept
/api/ttsand/api/transcribeaccepting unbounded client payloads- no per-call record of which cost class a request belonged to
Context matters here, because that list reads like negligence without it. This started as a hackathon project, built to win one. At that stage the only thing that counts is the thing working end to end, in front of judges, on time. Rate limiting, authentication and per-user quotas were not oversights, they were deliberately not built yet. They are also not controls you design in a vacuum: the sensible ceilings depend on which client is about to sign and what their traffic looks like, and none of that existed in August. Deferring them was the right call and I would make it again.
One thing was not missing, and it is the reason I found out in two days instead of at the end of the month: I did have a budget alert, set at R$100, and it fired. It did precisely what a budget alert does, and precisely nothing beyond it. It told me the total had crossed a line. It could not tell me which line.
That is a fact about the alert I had configured, not about the tool. A budget can be scoped to a project, a service or a set of labels, and billing export to BigQuery will break spend down by SKU. Mine was a single threshold on the account total, which is what you set up when you want to know that something is wrong and have not yet decided what you will want to know about.
That gap is the whole lesson. An alert is a threshold on a sum, so the only action it can suggest is the blunt one: start turning things off until the number stops moving.
I chose not to, and two things made that a calculation rather than bravado. The spend was inside what I could absorb, unpleasant as it was to watch it climb, and I had a second number of my own in mind past which I would have killed everything regardless of how much I had figured out. More importantly, the app was not in production. Nobody depended on it, no customer would have noticed either the spend or a shutdown, and the only thing exposed was my own money. Under those conditions, leaving it running was the cheapest way to buy evidence, because turning it off would have taken the symptom away along with every trace of the cause.
In production that arithmetic inverts, and it is worth saying so plainly, because the right move here is the wrong move there. If a deploy is what started the climb, the first action is an immediate rollback, before any diagnosis: you restore known-good behaviour, stop the spend, and reproduce the problem in an environment where studying it is nearly free. You investigate on the live system only when rolling back is not available, and while you do, you are paying for evidence by the hour. I ran the diagnosis half of that and skipped the rollback half for an unglamorous reason: there was no production environment to roll back to.
What would have turned that investigation into a query is the line I actually did not have: a cost class recorded on every call. With chat, tts, transcribe and cache creation each tagged and priced, the answer is a GROUP BY. Without it, all I had was a number going up and a system with one instrumented path out of four.
The order I settled on for when these controls do get built is deliberately not the order that feels natural:
- Size ceilings before frequency ceilings. A rate limit does not limit cost when the payload is unbounded: “10 per minute” still permits ten requests of 50,000 characters each. Size caps are stateless, need no shared counter and no identity decision, and they bound the worst case of each request in isolation. Set one too low and it will reject legitimate input, which is a calibration problem you fix with a number. What it will never do is reject a request because of someone else’s traffic, which is the failure mode built into every frequency ceiling. Half an hour of work.
- A cost class on every call. The alert gives you a total; this gives you the breakdown that makes the total actionable. It is a column, not a system, and it is what separates “spend is up” from “spend is up because cache creation ran 400 times”.
- Measure the unmeasured paths, one real TTS call and one real STT call with logging on, so ceilings are calibrated with numbers instead of guesses.
- Global ceilings per cost class, kept in Postgres rather than in memory (on serverless, instances come and go, so an in-memory counter leaks limit at random), with a kill switch from the first commit so the QA battery does not trip its own limit.
- Per-IP ceilings, generously. A demo where a whole team tests from one room is the worst case for per-IP limiting, and corporate wifi and CGNAT do the same thing. It is also weak in the other direction: changing IP is cheap for anyone actually abusing the system.
Note that steps 1 and 2 are the cheapest items on the list and neither is a feature. The expensive part of this incident was not building anything, and it was not the missing alarm either. It was having an alarm that could only tell me that money was leaving, in a system that could not tell me where.
10. Lessons learned
An experiment you leave running stops being an experiment. I switched the cache on for a cost reason and then validated it on a quality criterion: the answers were good, so it stayed. Those are two different questions, and nothing in the system forced me to notice that I had only answered one of them. Anything you switch on to try out needs a decision or an expiry date attached the same day, and that decision has to be measured against the reason you switched it on.
A cache is a bet that you will reuse what you stored. Priced per hour, that bet has a running cost. If the reuse does not happen, or if the stored thing keeps being replaced, you pay rent on something nobody reads.
Caching is not a fix for sending too much data. At best it relocates the bill, and in my case it added to it. If the number you are about to cache is absurd, the number is the bug and the cache is the symptom.
Read the pricing page for the feature, not just for the model. Per-token price is what everyone compares. My money left through cache creation and per-hour storage, two lines that never appear in a model comparison table.
An alarm is not instrumentation. The budget alert did its job and told me the total had moved. Attribution is a different feature, and I did not have it: 424 logged events, all of them the cheapest path, nothing recorded for the three paths that could plausibly have been the expensive one. A threshold on a sum tells you to panic. A breakdown by SKU tells you what the provider charged for. Only a record of your own calls tells you which part of your product did it.
Prefer the cache you do not have to configure. Implicit caching needs no configuration and bills no storage at all, which is the line that bit me here. Explicit caching is for content that is genuinely large, genuinely stable, and genuinely read many times before its TTL expires. You should be able to state which of those three you have measured.
Spend that does not follow usage is worse than spend that is high. US$45 is noise. US$45 in 48 hours with nobody using the product means the bill had stopped depending on me, and what I do not control I also cannot size.
11. Conclusion
The short version of this story is that I switched a cache on to test it, the answers came out fine, I forgot it, and it billed me by the hour until I noticed. The useful version is that the cache was never the real problem: a design that sent 363,000 tokens per message was, and the reason it took days rather than minutes to find is that the alert could tell me the total had moved while nothing in my own system could tell me what had moved it.
Adopting these APIs means adopting a billing model most of us have not internalised yet, and one that is wider than the language model itself: the same invoice carries storage, cache creation, audio output and text output, priced on entirely different scales, and the cheapest possible mistake is the one you notice in an hour instead of a week. A budget alert will tell you that money is leaving. Deciding, on day one, to record what each call cost and why is what tells you where it went.